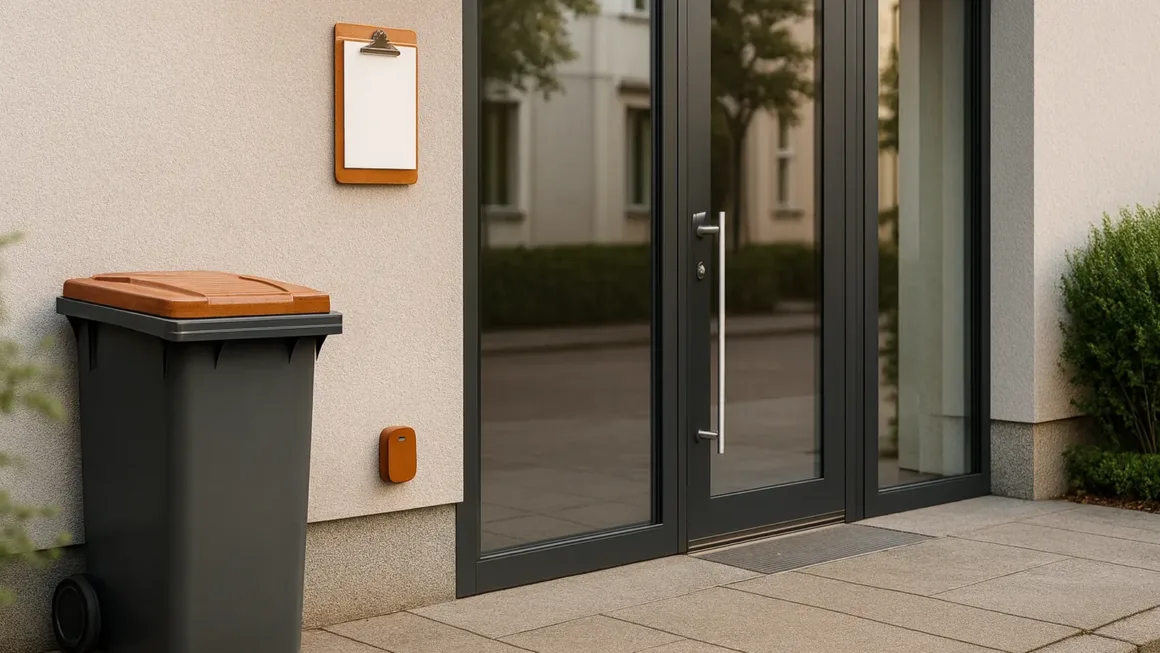
On Tuesday mornings I walk our building’s perimeter with coffee in one hand and a flashlight in the other. It takes seven minutes. Those walks—door gaps, propped dock bays, a lid off the outside bin—prevent more emergencies than any last-minute spray. Good commercial pest control is boring, predictable, and documented.
Protect Your Reputation
In brief: Your reputation is your most valuable asset; one pest incident can undo years of work. Stop problems before guests ever see them.
One post about a mouse can tank months of five-star effort. Food venues are judged against standards modeled on the FDA Food Code 2022 and the 2024 supplement used by local inspectors. Prevention plus clean documentation keeps customers—and auditors—confident. If you’re ramping up front-of-house and back-of-house standards, see these ops pieces: 10 Benefits of Hiring a Restaurant Cleaning Service and Janitorial Services vs. In-House Cleaning.
For cadence and responsiveness, review local providers like Greenville Pest Control and note how proactive inspections replace one-off treatments.
Evidence — Health departments regularly cite pests among top violations, and closures over cockroach/rodent activity are common in inspection roundups.
Stay Compliant
In brief: Inspectors expect prevention, sanitation, and records that align with the Food Code. Consistency beats any single product.
Regulated spaces must show active prevention and documentation aligned with the FDA Food Code. Offices and healthcare facilities should limit exposure to pests that spread disease; see CDC—rodent control and CDC—hantavirus. Build sanitation cadence into your SOPs—start with a documented grease trap cleaning schedule for food premises.
Teams like DAPS Pest Control build visits around inspection findings, log corrective actions, and leave you with records you can hand to an auditor.
What inspectors look for (quantified) — Programs modeled on Food-Code prevention + documentation show measurable outcomes in institutional settings: dust samples with detectable pest allergens drop from ~44% to ~14% under IPM approaches.
Prevent Property Damage
In brief: Rodents chew wiring; termites weaken structures; birds clog vents. Prevention is cheaper than crisis call-outs.
The EPA’s Integrated Pest Management (IPM) principles provide a clear playbook: monitor → identify → set thresholds → use the least-toxic control that still works → verify results. Facilities that switch from calendar spraying to IPM report ~99.9% less active pesticide used with maintained control, fewer emergencies, and steadier OPEX. If you suspect wood damage, review termite treatment options and the most effective treatments to understand remediation paths, and if leaks have created wet subfloors, follow this guide to repair water-damaged floors.
Providers such as Get Lost Pest Control lean into prevention, which is where long-term savings live.
Support Employee Health
In brief: A pest-free space is a quiet signal that leadership cares—and it reduces allergen triggers.
Cockroach and rodent allergens are recognized irritants; the CDC review on cockroach allergen exposure is a useful primer. Moisture invites activity, so facilities teams pair IPM with guidance like NIOSH—mold and moisture and, when needed, building fixes such as crawl space encapsulation to break the damp→pest cycle.
Why DIY Alone Falls Short
In brief: Traps and sprays hide symptoms; they don’t change conditions. Auditors also want logs, not receipts.
Store products can knock down what you see without fixing causes. Businesses need inspection, exclusion, sanitation, monitoring, targeted treatment, and documentation—the backbone of the EPA’s IPM approach and the standard inspectors expect to see in your records. Not sure when to escalate? See when to call a pest control pro.
The Practical IPM Routine
In brief: Small, repeatable habits beat big, reactive fixes. Tie your routine to logs and trend reviews.
Weekly (≈10 minutes)
- Walk the perimeter; close propped doors; check the bin area; seal entry points to prevent rodents.
- Flush floor drains; keep floors dry.
- Lift pallets 18 inches off walls; reduce cardboard clutter.
Monthly (≈30–60 minutes)
- Review the service report and device map with your provider.
- Close out corrective actions; sign and file the log.
- Brief staff on one habit change (e.g., keep back door closed during deliveries).
Cadence
- Low-risk office/retail: monthly inspections usually hold the line.
- Food, hospitality, healthcare: bi-weekly or weekly until trends flatten, then taper.
- Seasonal spikes/renovations: increase frequency for a cycle, then reassess.
For templates and step-by-step references, use the EPA IPM Toolkit.
Data-Backed Outcomes (benchmarks you can aim for)
In brief: IPM lowers risk and chemical use while holding control—often with equal or lower total cost after ramp-up.
- ~99.9% less active pesticide used under school/facility IPM vs. calendar spraying, with control maintained.
- Detectable pest allergens in dust: ~14% with IPM vs. ~44% in conventional programs.
- Costs hold or drop after year one; labor share rises while material spend falls.
- Documented district savings include ~US$17,100/year on a ~US$9,300 startup investment; other programs report ~US$11,000 the first year and >US$10,000/year ongoing.
- Process-driven IPM in food plants can surface hundreds of thousands in annual line-hour savings by cutting pest-related disruptions and rework.
Mini Case Studies
Case 1 — Multi-site school district
- Setting: 100+ facilities shifting from monthly sprays to IPM.
- Actions: Monitoring network, exclusion, sanitation SOPs, device map, digital logs.
- Results: ~99.9% less active pesticide applied; ~14% vs. ~44% detectable allergens under conventional programs; costs held flat or decreased after year one.
Case 2 — District ROI snapshot
- Setting: Startup IPM spend of ~US$9,300 for monitoring supplies and staff training.
- Results: ~US$17,100/year savings; payback < 7 months; continued annual savings from fewer materials and targeted treatments.
Case 3 — County facilities program
- Setting: Integrated IPM across grounds and buildings.
- Results: ~US$11,000 saved in year one and >US$10,000/year thereafter via reduced applications and better targeting.
Case 4 — Food & beverage plant
- Setting: High-throughput bakery ties IPM to sanitation and scheduling.
- Results: ~US$850,000/year line-hour savings identified (≈+2.2% margin) by eliminating pest-driven disruptions and rework.
Use the case numbers as targets: ask vendors to show trend reports proving reductions in captures or conducive conditions within 60–90 days.
Choose a Provider You Can Audit
In brief: Pick for proof, not promises—commercial references, digital reports, clear SLAs, and a site-specific plan.
- Commercial experience in your industry.
- Digital reporting with trend charts and a numbered device map.
- IPM-first plan, eco options on request, and clear response times.
- Licenses, insurance, and background-checked techs.
- A site-specific scope instead of “monthly spray.”
Compare local options and collect at least three quotes. Examples to evaluate: Greenville Pest Control, DAPS Pest Control, Get Lost Pest Control.
What Drives Cost
In brief: Scope, risk, and current pressure set price. Prevention contracts beat cleanouts on total cost.
- Square footage and layout complexity.
- Risk profile (food handling and patient-care zones need tighter cadence).
- Current pressure level (cleanout months cost more than maintenance).
Ask vendors to specify interior/exterior coverage, visit cadence, emergency response window, portal access to reports, and device-replacement terms. If sanitation staffing is the bottleneck, compare models in Janitorial Services vs. In-House Cleaning.
| Scenario | Investment | Outcome |
|---|---|---|
| District IPM startup | ~US$9,300 | ~US$17,100 saved per year; payback < 7 months |
| Facilities IPM rollout | — | ~US$11,000 saved in year one; >US$10,000/year thereafter |
| Chemical use under IPM | — | ~99.9% less active pesticide vs. calendar spraying |
| Allergen exposure | — | ~14% detectable allergens with IPM vs. ~44% conventional |
A Small, Real Example
In brief: Simple fixes, documented, can flip outcomes in weeks.
A three-unit café group failed an inspection for fruit flies and rodent droppings near the alley door. They added a door sweep, sealed the outside bin, scheduled weekly drain foam, and started a basic device map and staff log. Sixty days later they passed re-inspection and eliminated two emergency call-outs a month.
Final Takeaway
In brief: The ROI comes from routine—short inspections, tidy records, small fixes that stack up.
Make IPM part of operations—grounded in the FDA Food Code and EPA IPM principles—so you spend less time fighting pests and more time serving customers.
10-Minute Checklist (Quick Reference)
In brief: Do these today; book quotes this week.
- Perimeter walk: close door gaps, shut propped doors, tidy the bin area.
- Flush floor drains; keep floors dry.
- Lift pallets 18″+ off walls; reduce cardboard clutter.
- Start a Pest Log: date, sighting, location, action; save to your shared drive.
- Email photos and notes to your provider before the next visit.
Sources (authoritative)
- FDA Food Code 2022 — PDF; 2024 Supplement — PDF
- EPA — IPM principles — Overview
- EPA — IPM Toolkit — PDF
- CDC — Rodent control — Guide; Hantavirus — Overview
- CDC — Cockroach allergens — Review
- NIOSH — Mold & moisture — Guide
FAQ
In brief: Quick answers for busy owners. Open a question to see the details.
Do small businesses really need professional pest control?
Yes. DIY housekeeping helps, but inspectors expect prevention, monitoring, and documentation. A professional IPM program provides logs, device maps, and targeted treatments that satisfy audits and reduce emergencies.
How often should service visits happen?
Low-risk offices/retail: monthly is typical. Food, hospitality, and healthcare: bi-weekly or weekly until trend data stabilizes, then taper. Increase frequency during seasonal spikes or renovations.
What does a commercial visit include?
Inspection of interior/exterior, device checks, sanitation notes, targeted treatments, and updates to your service log, device map, and corrective actions.
What documentation do inspectors expect?
An IPM plan/policy, service reports with trend graphs, a numbered device map, closed corrective actions, and accessible SDS/MSDS.
Can we handle pests with DIY only?
DIY can maintain cleanliness and basic exclusion, but it rarely meets compliance. Professional monitoring, data-driven decisions, and formal records close the gap.
How long until we see results?
Minor issues often improve within 2–4 weeks. For higher pressure sites, expect clear trend improvement within 60–90 days if sanitation and exclusion steps are followed.
Are eco-friendly or low-tox options effective?
Yes—when used inside an IPM program. Start with exclusion and sanitation; use least-toxic controls first and escalate only if monitoring data indicates.
What affects cost the most?
Square footage and layout, risk profile (e.g., food handling), and current pressure level. Prevention programs cost less over time than reactive cleanouts.

 2")


 7")

 9")
